Overview
The images below are created with JavaScript/jQuery and the Processing.js API. I am in the process of re-visiting this project with Python. The "exposures" below were left overnight on a mid-grade machine before I reviewed them.
A lot of my personal studies revolve around fractals and mathematically/programmatically driven art. I have been fascinated with fractals and the beauty they easily show (seemingly). The fact that simple equations create something like this is honestly dumbfounding to me.
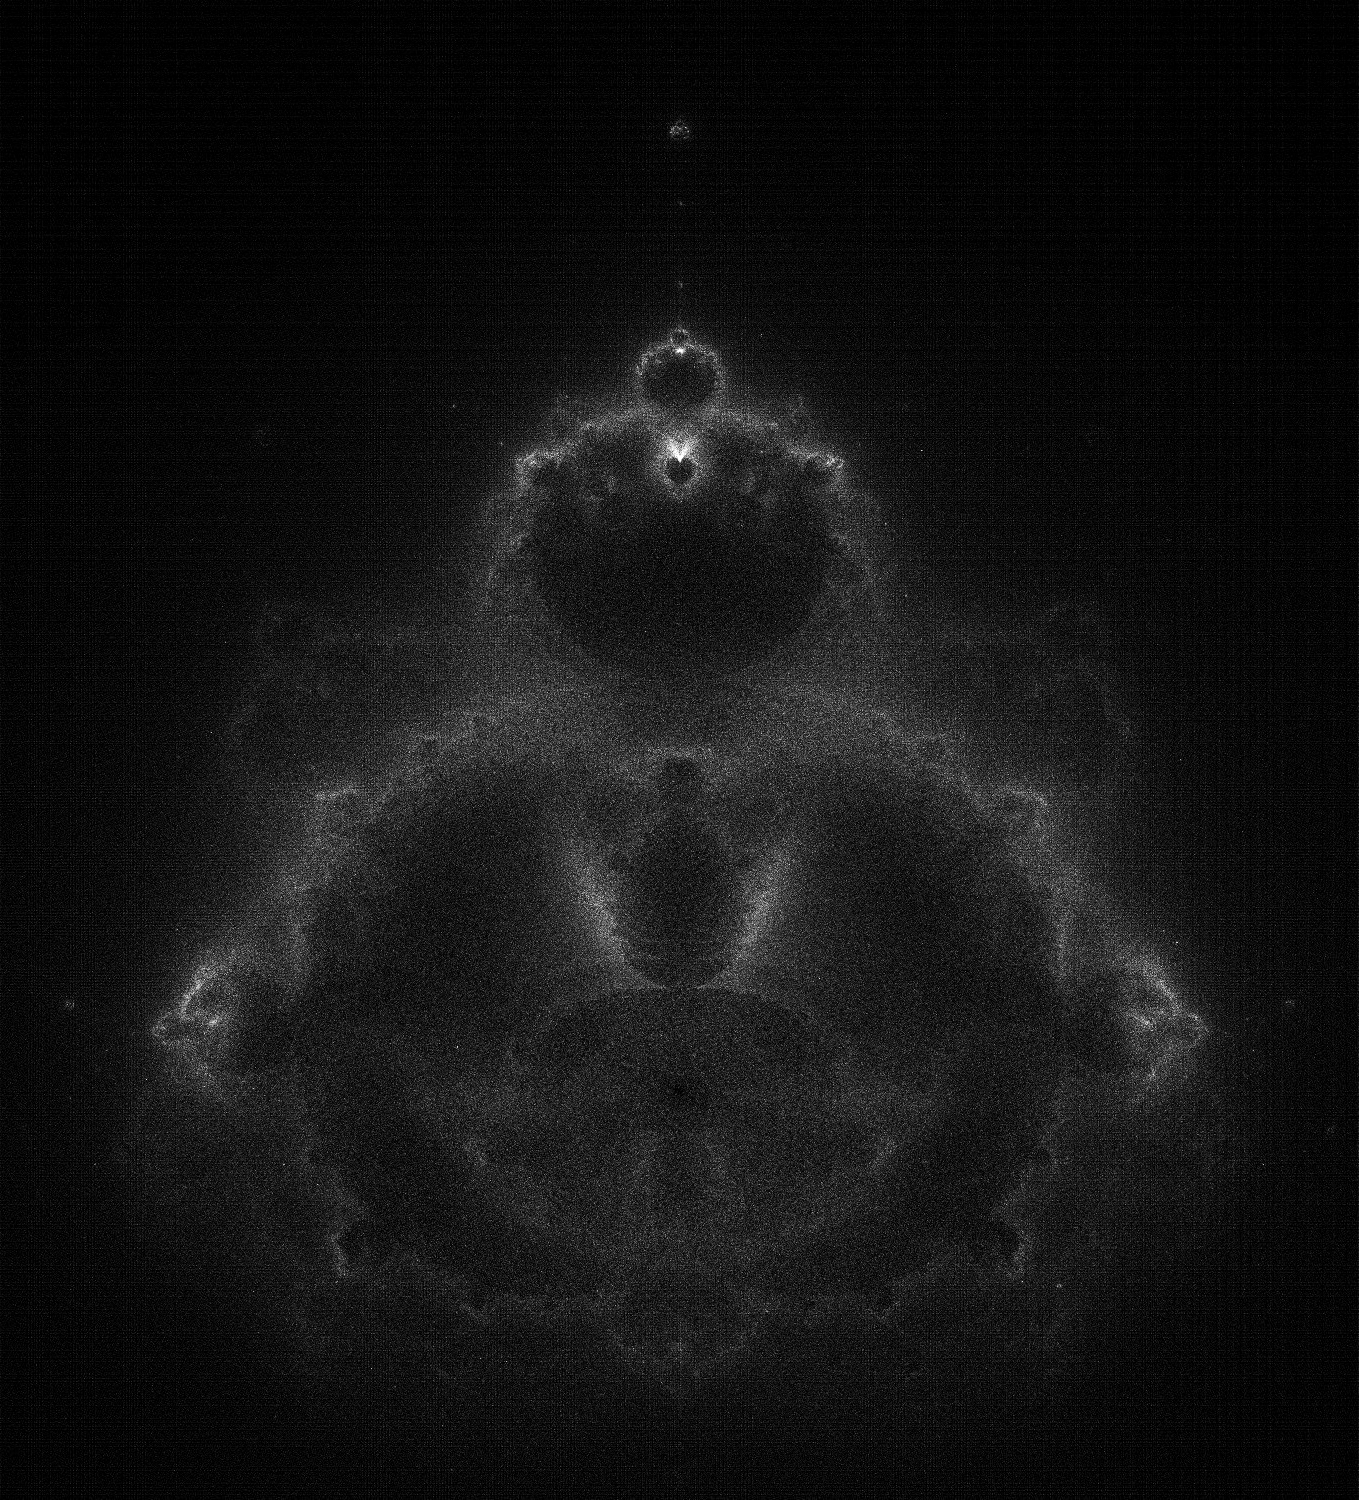
I stumbled upon this method of visualizing the Mandelbrot set conceived by Melinda Green. Rather than keeping track of points on the complex plane before they escape towards infinity (points that are actually a part of the set), Melinda Green proposes that randomly selected points that in fact diverge out to infinity should be kept tracked of, and their orbit as they escape plotted. The result is this very beautiful, almost nebula-like rendering. Millions and millions of randomly selected points must be recursed through the standard Mandelbrot set equation before any sort of dense-looking renderings occur.
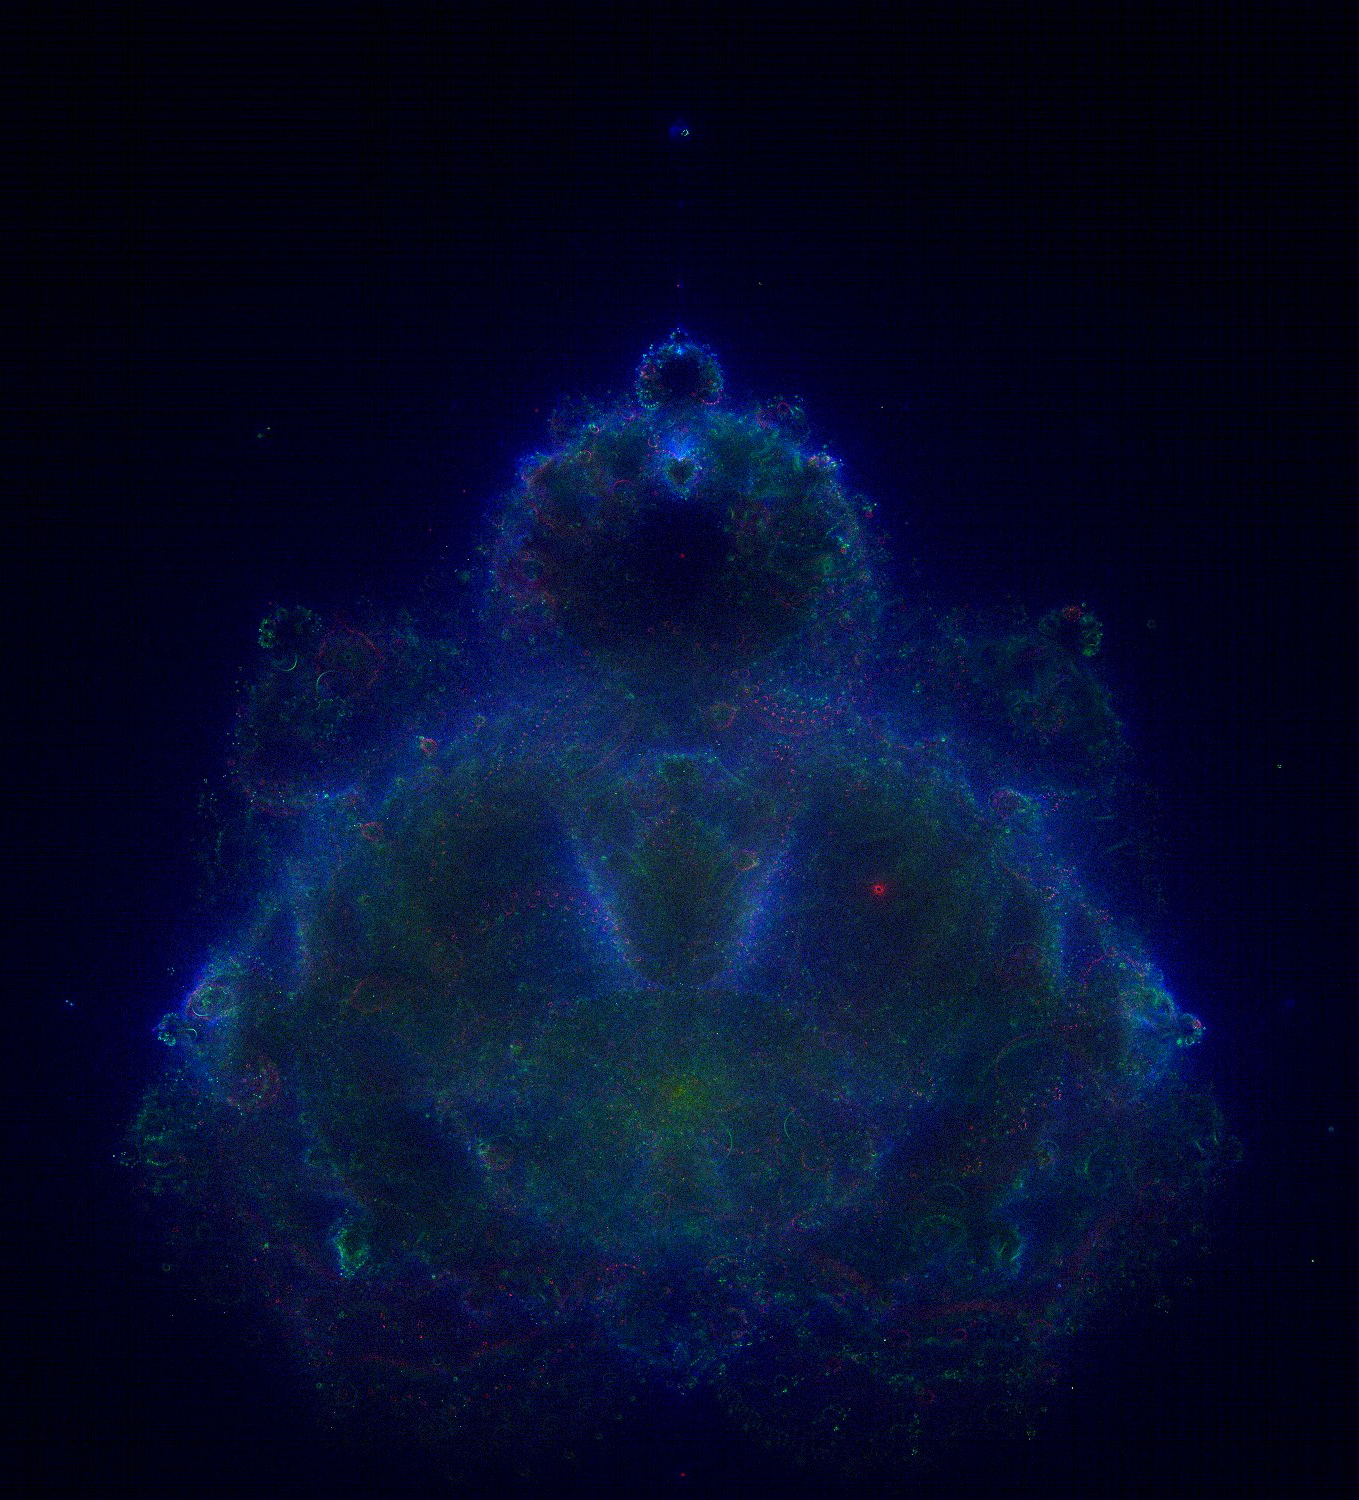
The colored image is determined by the number of iterations a particular point took before it escaped to infinity. Red represents more than 50000, green more than 5000, and blue more than 500.
Color is based on number of iterations before deeming a pixel "escaped." With iterations of 500, 5000, 50000 respectively to blue, green, red we are able to obtain more of a "nebula" form.
Buddhabrot
Generative Art / Personal Project